Process & Disk Commands
Process Commands
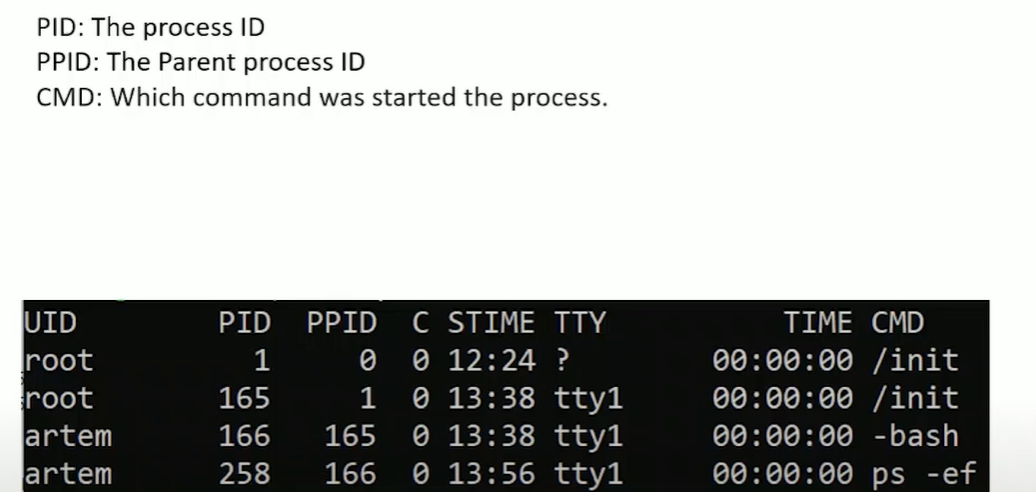
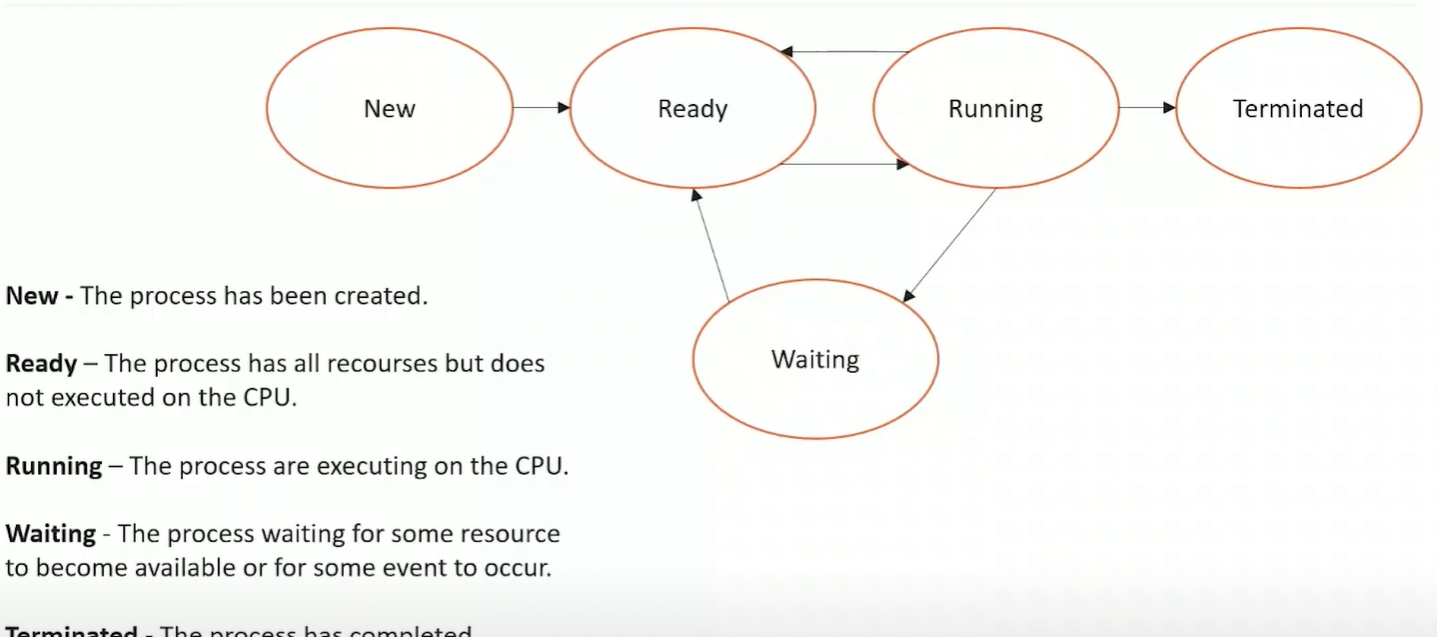
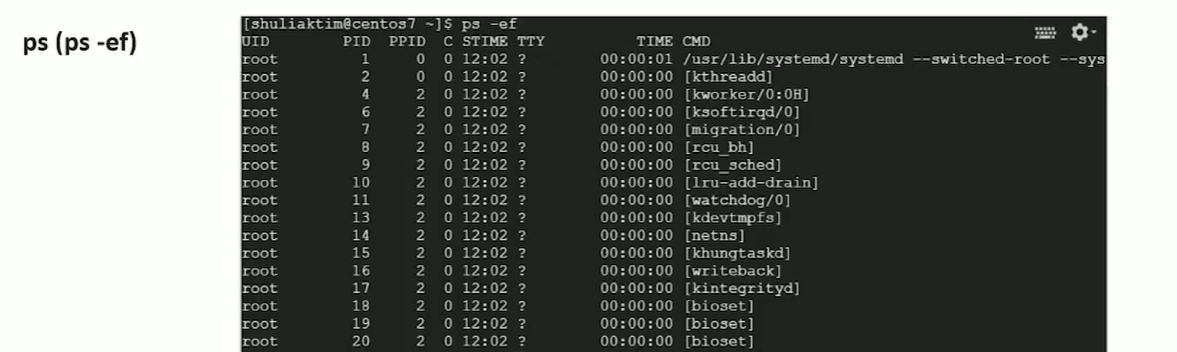
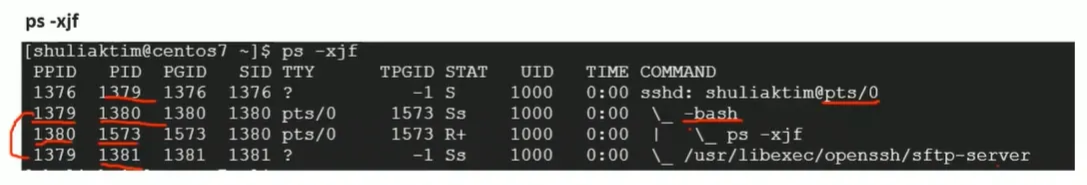
Section titled “Process Commands”- process is a running instance of a program
to
Memory
Section titled “Memory”-
vmstat- provides instant reports on your system’s processes, memory, paging, block input/output, interrupts, and CPU activity. Vmstat lets you set a sampling interval so that you can observe system activity in near-real time.-
Example:
Terminal window $ vmstat -aprocs -----------memory---------- ---swap-- -----io---- -system-- ------cpu-----r b swpd free inact active si so bi bo in cs us sy id wa st1 0 0 332128 85800 505656 0 0 5 10 13 17 0 0 100 0 0$ vmstat -f11703 forks #total number of tasks created since last boot.# vmstat -w 1 3# vmstat -s
-
-
free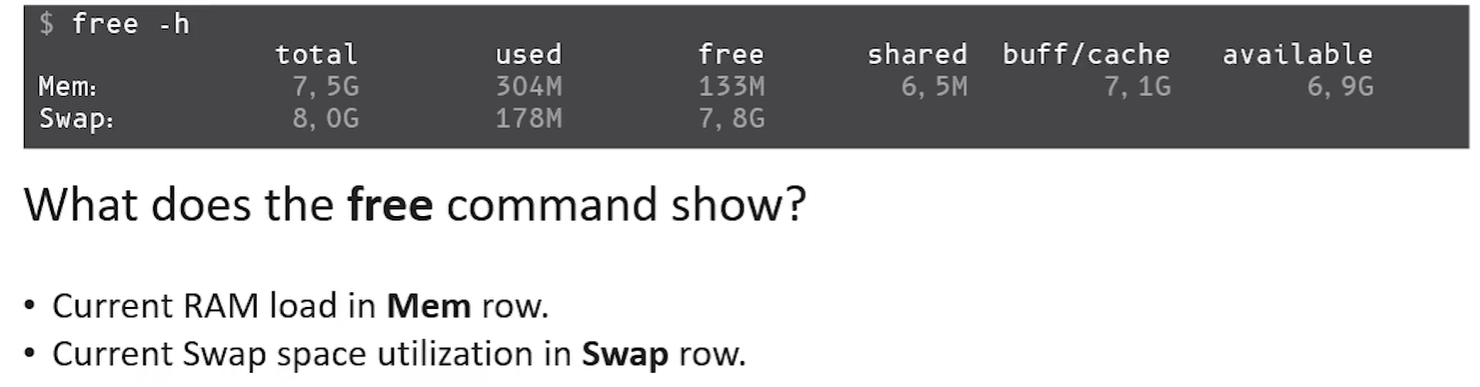
total: The total amount of memory in your system.used: The amount of memory currently used by applications.free: The amount of memory not being used by anything.shared: Memory shared between different processes.buff/cache: Memory used by the system for buffers, cache, and slab (kernel data structures). This can be freed if needed.available(free + cache/buff): The memory that can be used by applications. This includes free memory and the memory used by cache that can be freed.
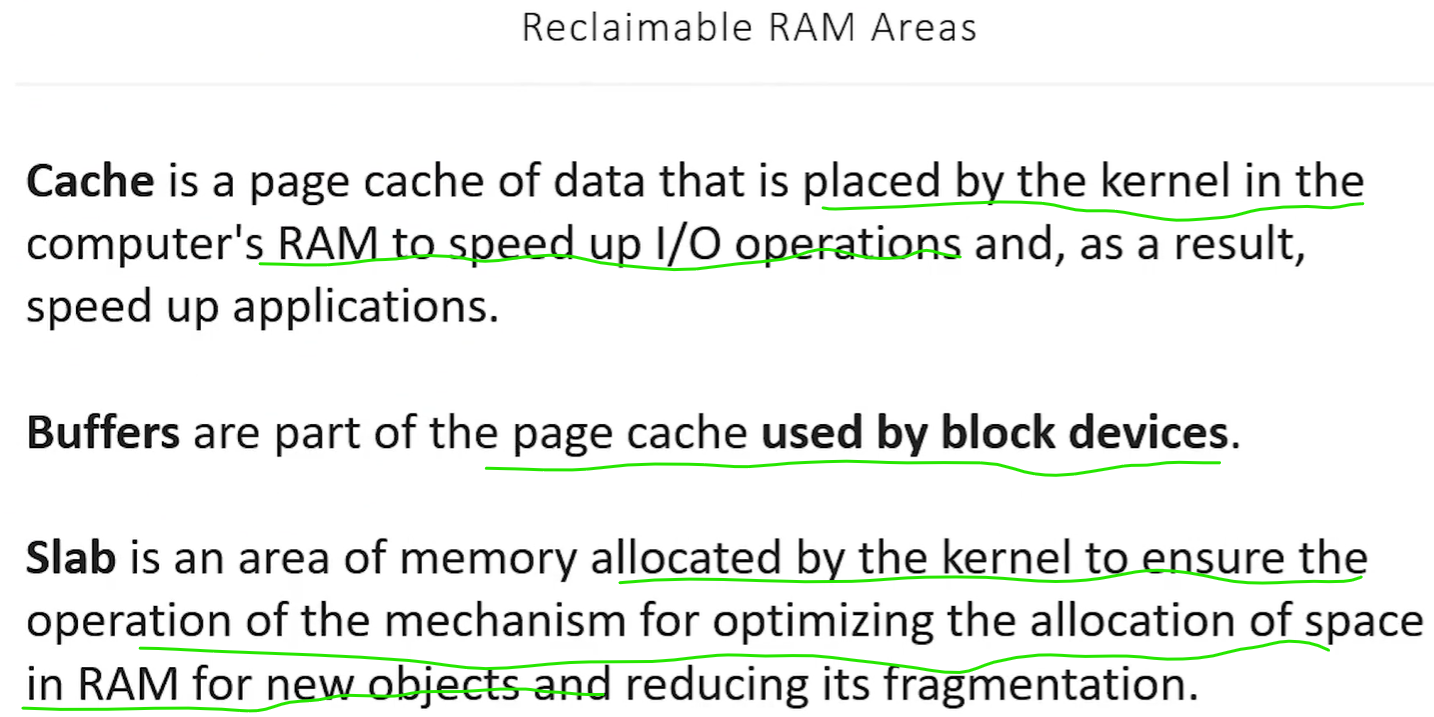
What is Buffer Memory?
- It’s used for storing data temporarily while it’s being written to or read from storage devices.
- Buffers store temporary data and are reclaimable when the system runs low on memory
What is Slab Memory
- The slab is memory used by the kernel to store data structures like process control blocks or file handles. It’s the kernel’s way of managing its own memory for things it needs to operate.
Swap Memory
Section titled “Swap Memory”- Swap is virtual memory that exists on the hard drive (HDD or SSD). It’s used when the system’s RAM is full.
- Swap memory is slower than RAM but provides additional space.
- If the system runs out of RAM, it starts moving less-used data from RAM to the swap space.
- High swap usage means that your system might not have enough RAM to handle everything, and this can slow down the system performance.
- Swap Out: When RAM is full, the OS moves an inactive or blocked process from RAM to a designated area on disk called swap space, freeing up memory for active processes.
- Swap In: When the swapped-out process needs to run again, it is moved back from disk into RAM so the CPU can execute it.
-
**
lscpu**– gathers information about the CPU architecture, such as the number of CPUs, threads, cores, sockets, and NUMA nodes -
**
mpstat**– display CPU statistics of individual CPU (or) Core. If no activity has been selected, then the default report is the CPU utilization report. If no interval specified then processors statistics are to be reported for the time since system startup (boot).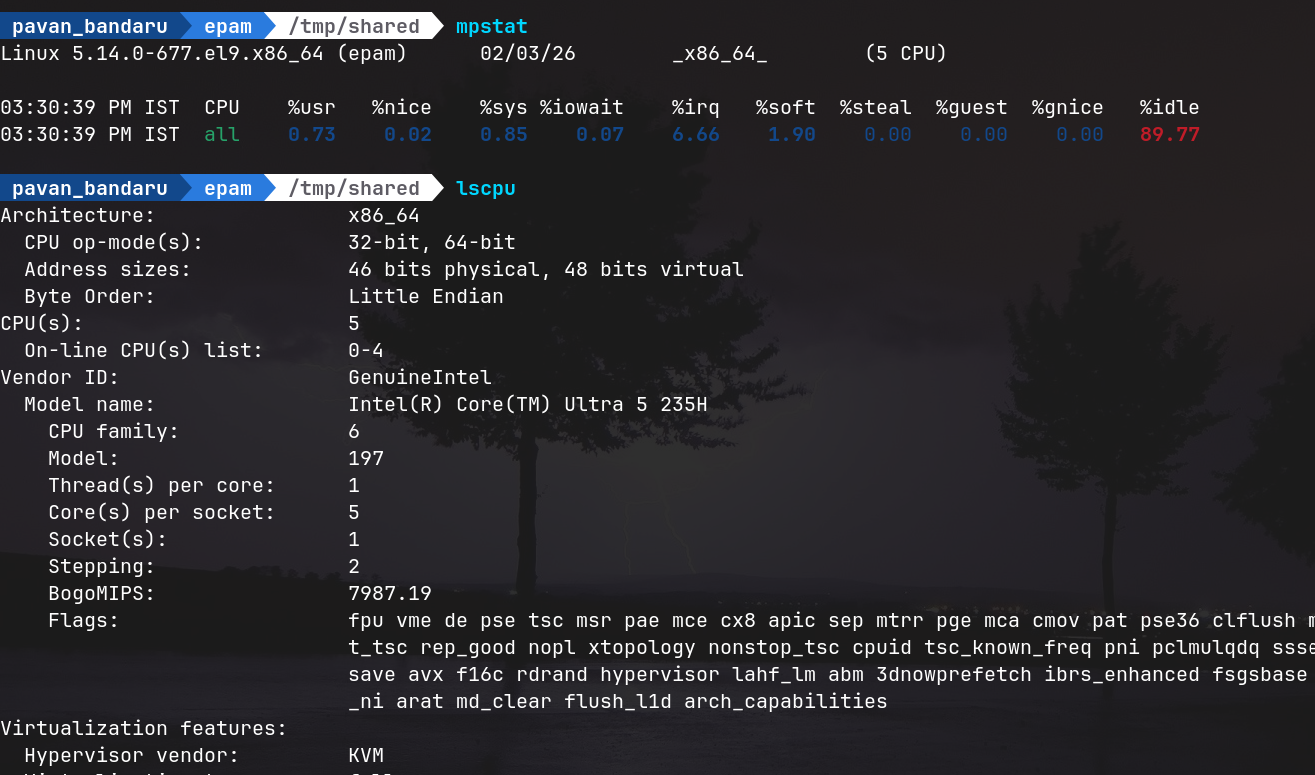
-
**
sar**– display CPU statistics of individual CPU (or) Core.Terminal window **$ sar -P ALL 1 1**Linux 2.6.18-194.el5PAE (dev-db) 03/26/2011 _i686_ (8 CPU)01:34:12 PM CPU %user %nice %system %iowait %steal %idle01:34:13 PM all 11.69 0.00 4.71 0.69 0.00 82.9001:34:13 PM 0 35.00 0.00 6.00 0.00 0.00 59.0001:34:13 PM 1 22.00 0.00 5.00 0.00 0.00 73.0001:34:13 PM 2 3.00 0.00 1.00 0.00 0.00 96.0001:34:13 PM 3 0.00 0.00 0.00 0.00 0.00 100.00 -
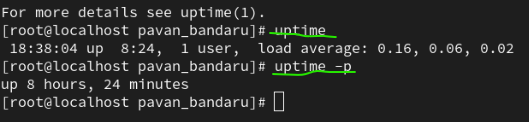
uptime -
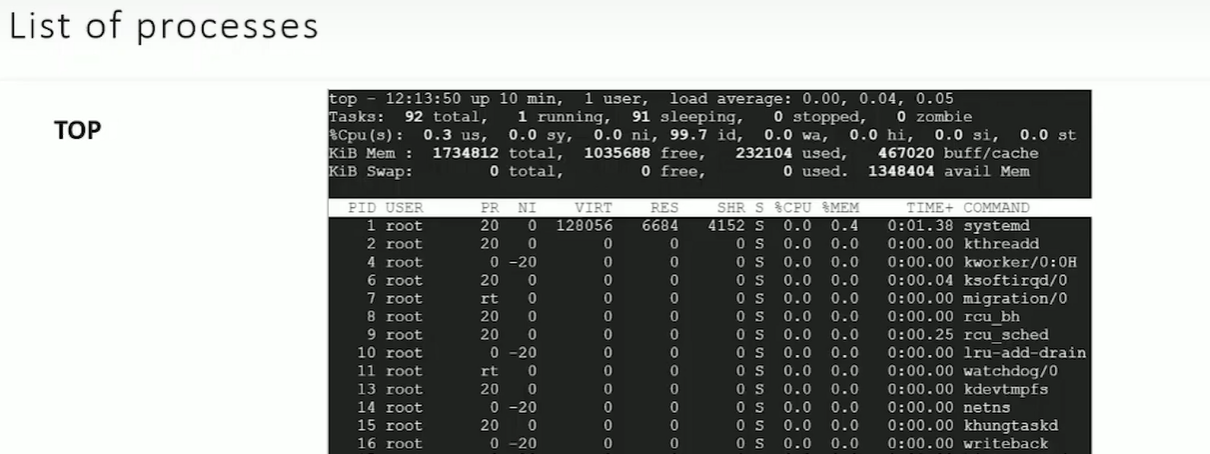
top -
nproc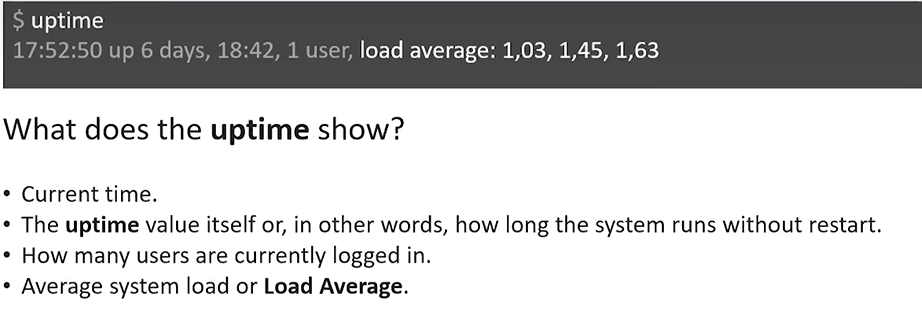
What is CPU Queue Length?
- CPU Queue Length is the number of processes that are waiting to be executed by the CPU.
- If there are too many processes waiting, your system might slow down because the CPU can’t handle all of them at once.
Load Average on Multi-core CPUs
- On multi-core CPUs, the load average is calculated per core.
- For example, if you have a quad-core (4 cores) CPU and the load average is 4.00, that means each core is fully utilized.
- If the load average is 1.00 on a quad-core system, that means only one core is being fully used, and the other cores are idle.
1. **Single-CPU System Example: "1.73 0.60 7.98"**
    **Understanding the Three Numbers:**
    The load average of **"1.73 0.60 7.98"** represents the system load (or how many processes were waiting to be executed) over the last **1 minute, 5 minutes**, and **15 minutes**:
    - **1.73**: Load average over the **last 1 minute**.    - **0.60**: Load average over the **last 5 minutes**.    - **7.98**: Load average over the **last 15 minutes**.
    Now, let’s break down each of these:

### **1st Number: 1.73 (Last 1 Minute)**
- **Interpretation**:    - The load of **1.73** means that, on average, there were **1.73 processes** waiting to use the **single CPU**.    - This means the system was **overloaded by 73%** because **1.0** would indicate perfect CPU utilization. Since the load is **1.73**, that means there was a need for more CPU time than available.    - **0.73 processes** had to wait for CPU time.    - **In simple terms**: The CPU was running at 100% usage, and there were 73% more processes waiting to be executed than the CPU could handle.
### **2nd Number: 0.60 (Last 5 Minutes)**
- **Interpretation**:    - The load of **0.60** means that over the last **5 minutes**, the system was **idle 40% of the time**.    - This means that for about 40% of the time, the system had **spare capacity**, and it wasn't fully utilizing the CPU.    - **In simple terms**: The CPU was underused, so there was no overload in the last 5 minutes.
### **3rd Number: 7.98 (Last 15 Minutes)**
- **Interpretation**:    - The load of **7.98** means that, on average, there were **7.98 processes** waiting to run.    - **This is a huge overload** because **the CPU can only handle one process at a time**, so **6.98 processes** had to **wait** for CPU time.    - The system was **698% overloaded** on average, meaning there were far more processes waiting than the CPU could handle.    - **In simple terms**: If the system had been 7 times as fast, it could have handled the workload.
---
### **Summary for the Single-CPU System Example**:
- **Last 1 minute (1.73)**: The system was **73% overloaded**, meaning there were more processes waiting to run than the CPU could handle.- **Last 5 minutes (0.60)**: The CPU was **mostly idle** for 40% of the time, so there was no significant load.- **Last 15 minutes (7.98)**: The system was **698% overloaded**, meaning there were almost **8 processes waiting for the CPU** instead of just one.
---
### **2. Multi-CPU System Example: "3.73" on 4 CPUs**
### **Understanding the Number:**
- **Load average of 3.73** means that, on average, there were **3.73 processes** waiting to use the CPUs.
### **Interpretation for 4 CPUs**:
- The system has **4 CPUs**. For a system with **4 CPUs**: - A **load average of 3.73** means there were **3.73 processes waiting** to run, which is **fewer than the 4 CPUs** available. - This means that all processes can be **handled simultaneously** because there are enough CPUs. - No **overloading** is happening because **3.73** is less than the **4 CPUs** available.df (Disk Free)
Section titled “df (Disk Free)”- What it is: Shows an overview of the total, used, and available space on all mounted filesystems.
- Essential Command:
df -h- The
hflag makes it human-readable (converts bytes to GB/MB).
- The
- Daily Use: Check this first if you get a “No space left on device” error to see which partition is full.
du (Disk Usage)
Section titled “du (Disk Usage)”- What it is: Shows how much space specific files or directories are consuming.
- Essential Command:
du -sh /etc/*s: Summary (total for the folder, don’t list every sub-file).h: Human-readable.
- Daily Use: Use this to find “space hogs.” If
dfsays your disk is full,duhelps you find the exact folder taking up all the room.
lsof (List Open Files)
Section titled “lsof (List Open Files)”- What it is: In Linux, “everything is a file.”
lsofshows you every file currently being accessed by every process. - Practical Examples:
lsof -i: Lists all active network connections (internet files).lsof -u username: See what a specific user is doing.lsof /path/to/file: Find out which process is “locking” a file so you can’t delete it.
iostat (Input/Output Statistics)
Section titled “iostat (Input/Output Statistics)”- What it is: Specifically focuses on the balance between CPU usage and disk I/O.
- Key Insight: Look at
%iowait. If this number is high, it means your CPU is sitting idle because your hard drive is too slow to keep up with its requests. - Example:
iostat -d(Disk only) oriostat -t(includes a timestamp).
Daily Life Summary
Section titled “Daily Life Summary”| If you need to… | Use this command |
|---|---|
| Check if the disk is full | df -h |
| Find which folder is taking 50GB | du -sh * |
| Identify what is using Port 80 | lsof -i :80 |
| Check if the CPU is waiting on the Disk | iostat (look for %iowait) |
| See detailed partition health | vmstat -p sda2 |